Hong Kong RPS historical winners review (2024–2026)
💡 Core insight: RPS signatures at the launch of major winners
By reviewing 8 major Hong Kong winners of recent years (SMIC, WuXi Biologics, Xiaomi, etc.), we found:Almost every primary advance started only after the RPS120 indicator had already broken above the 80 lineRPS making new highs ahead of price is the most reliable technical signal in the CANSLIM stock selection method for identifying “market leaders.”
This report selects the 8 most representative technology, internet and pharmaceutical leaders in the Hong Kong stock market from 2024 to 2026. By overlaying candlestick charts with the RPS120 relative strength curve , we can intuitively observe the remarkable performance of the RPS indicator before and after the launch of bull stocks.
1. SMIC (00981.HK)
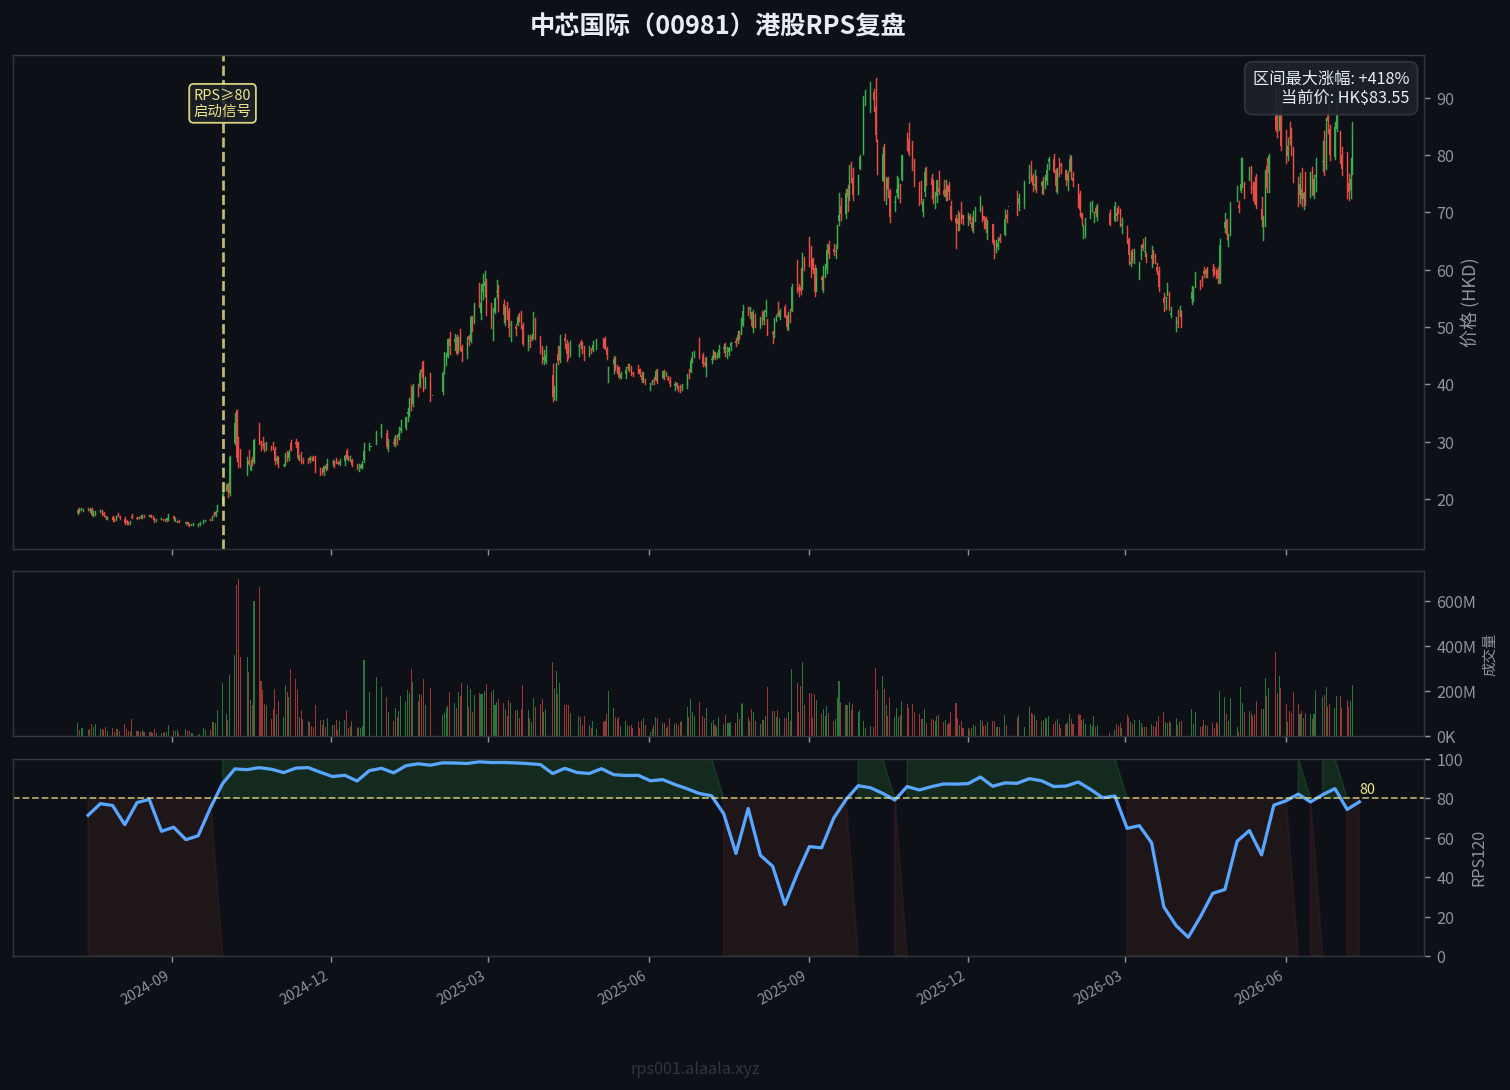
Case review:SMIC is the undisputed leader in this Hong Kong semiconductor rally. As clearly shown in the chart, on the eve of the main upward wave at the end of 9 2024,its RPS120 indicator strongly broke through the 80 benchmark line (yellow dashed line in the chart). The stock then enjoyed a Davis double play, with a maximum period gain of an astonishing 418%.
This perfectly confirms William O'Neil's theory: true super bull stocks will have their relative price strength enter the top 20% of the entire market (i.e., RPS≥80) before the breakout.
2. WuXi Biologics (02269.HK)
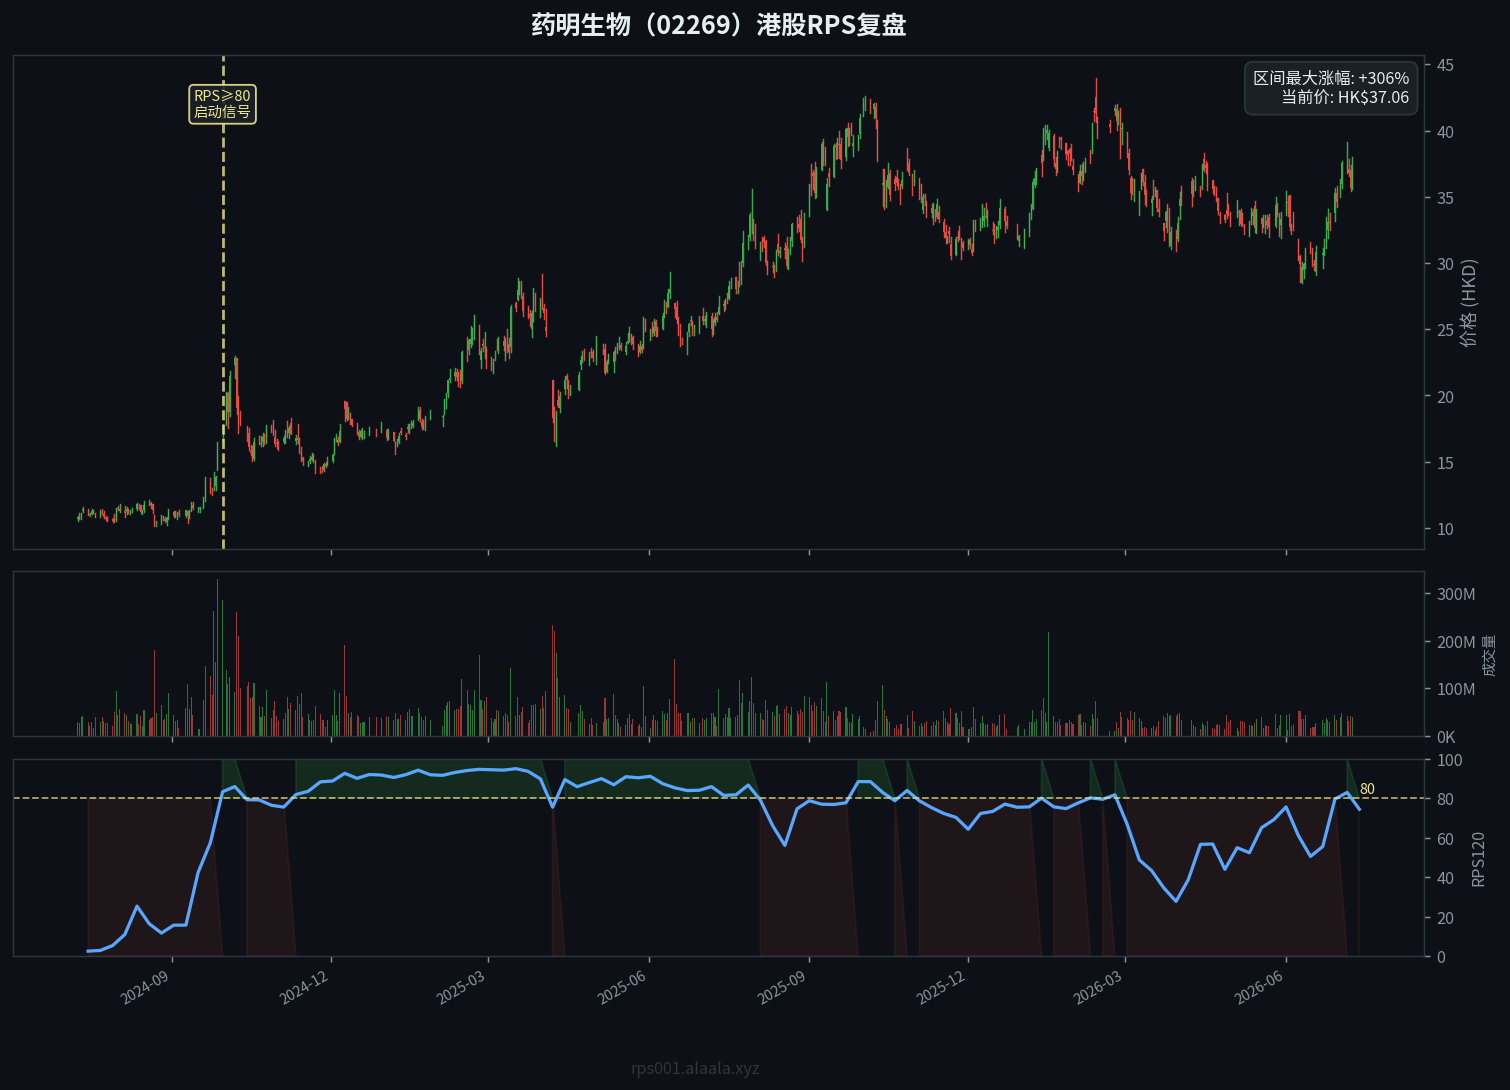
Case review:After a prolonged bottom consolidation, WuXi Biologics experienced a turnaround from adversity in the second half of 2024. Note the trend of the blue RPS curve at the bottom: while the stock price was still oscillating to form a bottom, RPS had already quietly risen and broke through 80 at the end of 9.
This “price hasn’t moved, RPS leads” bottom divergence is a typical characteristic of institutional accumulation. After breaking 80, the stock price quickly launched a spectacular tripling rally.
3. Xiaomi Group (01810.HK)
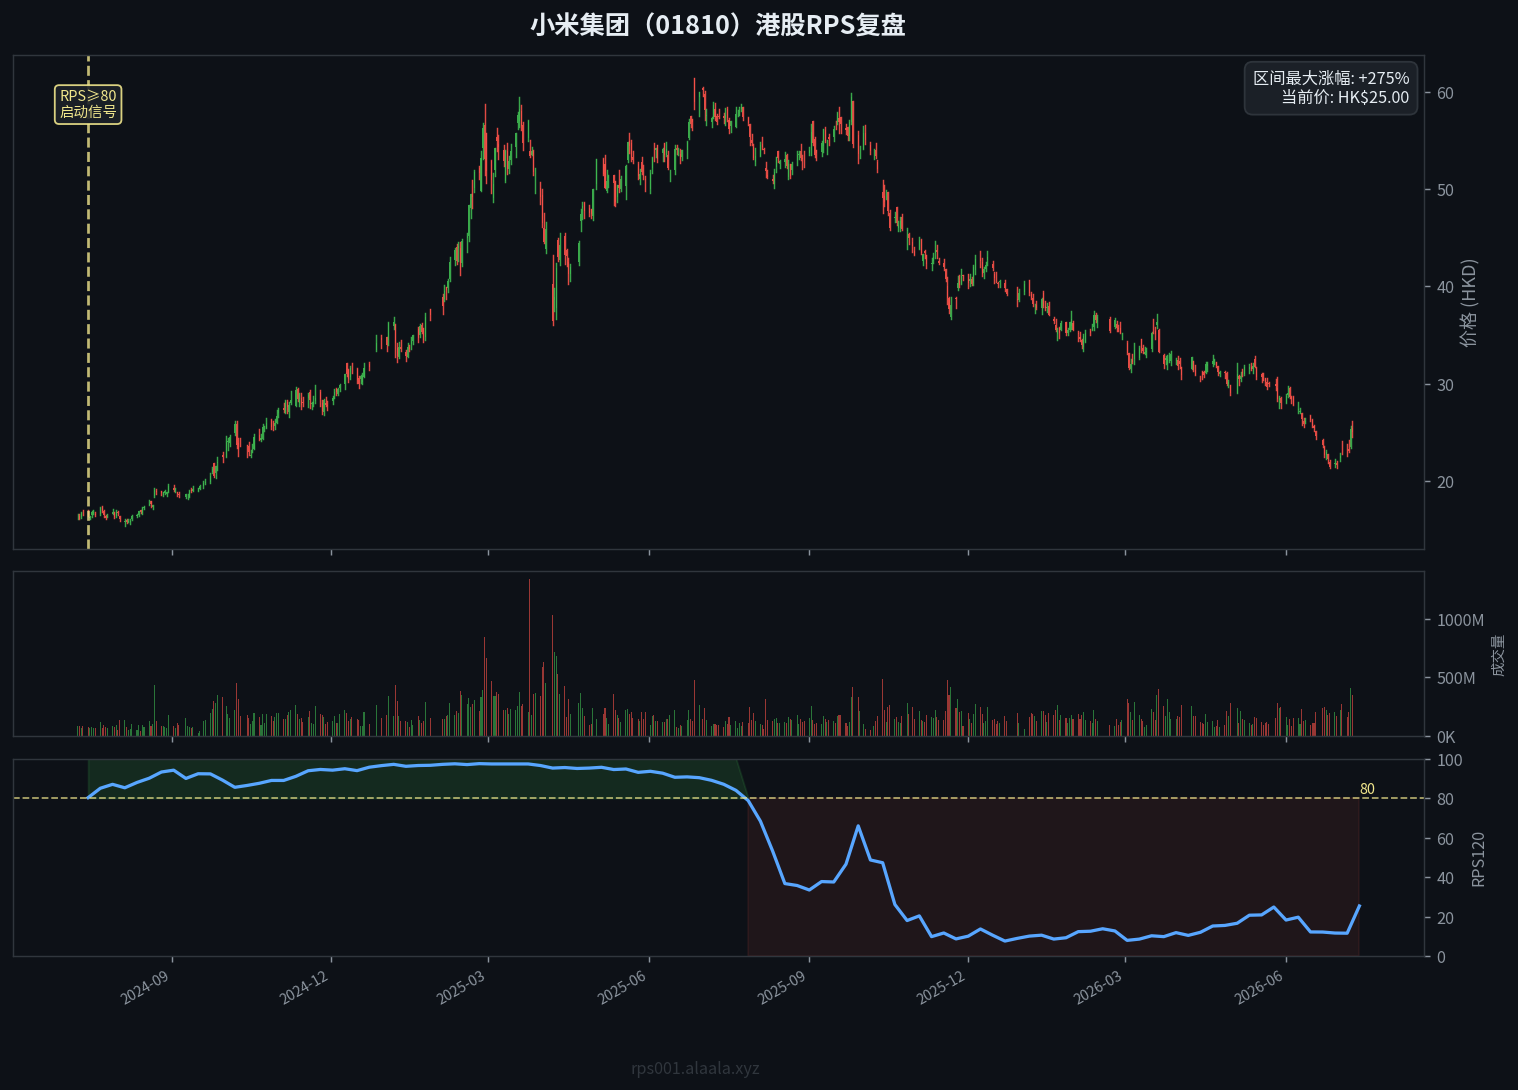
Case review:With the successful launch and delivery of Xiaomi vehicles, Xiaomi Group underwent a major re-rating of its fundamentals. As seen in the chart, as early as 7 2024, its RPS120 had already stood above 80 and subsequently remained at an extremely high level above 90 for a long time (green highlighted area in the chart).
While RPS remained at high levels, every pullback in the stock price (such as breaking below the 20-day moving average) was an excellent buying opportunity. This is the charm of strong stocks:As long as RPS does not break down, the trend will not end easily.
4. Alibaba (09988.HK)
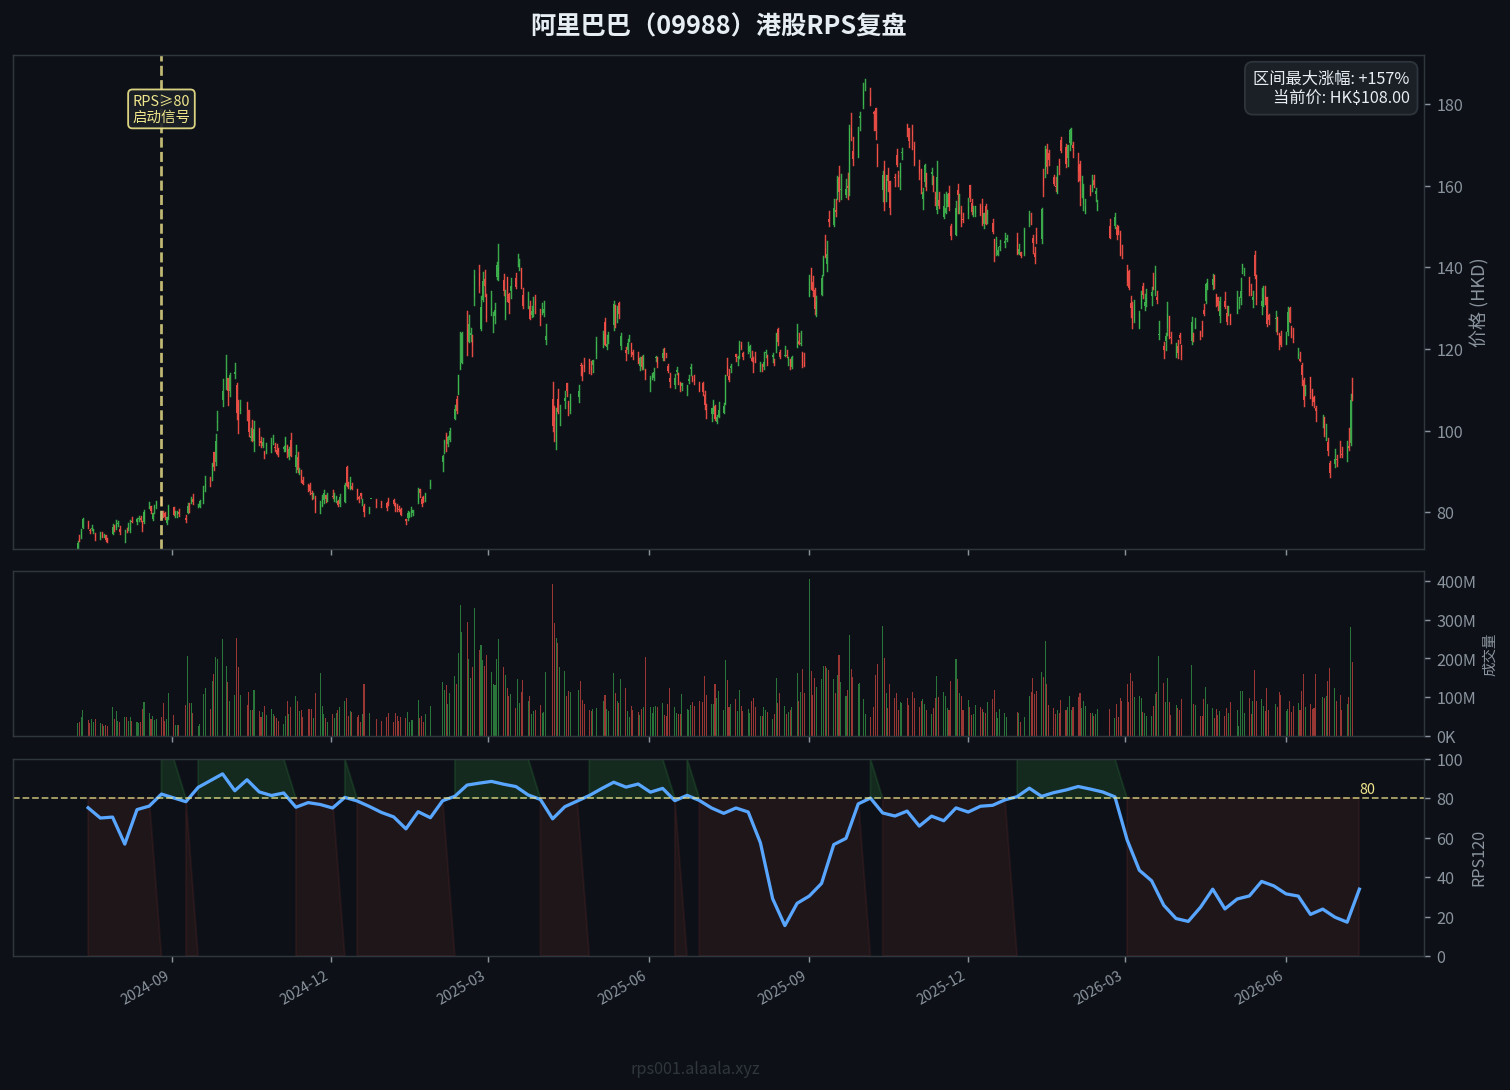
Case review:As a representative of large-cap blue chips, Alibaba issued an RPS breakout above 80 signal at the end of 8 2024. For such giants with market caps of hundreds of billions or even trillions, RPS breaking 80 indicates massive continuous inflows of major capital.
The stock price then rose steadily, with a period gain of 157%. This also proves that the RPS indicator is not only applicable to small- and mid-cap growth stocks but also to capturing trending opportunities in large-cap blue chips.
5. BYD Company (01211.HK)
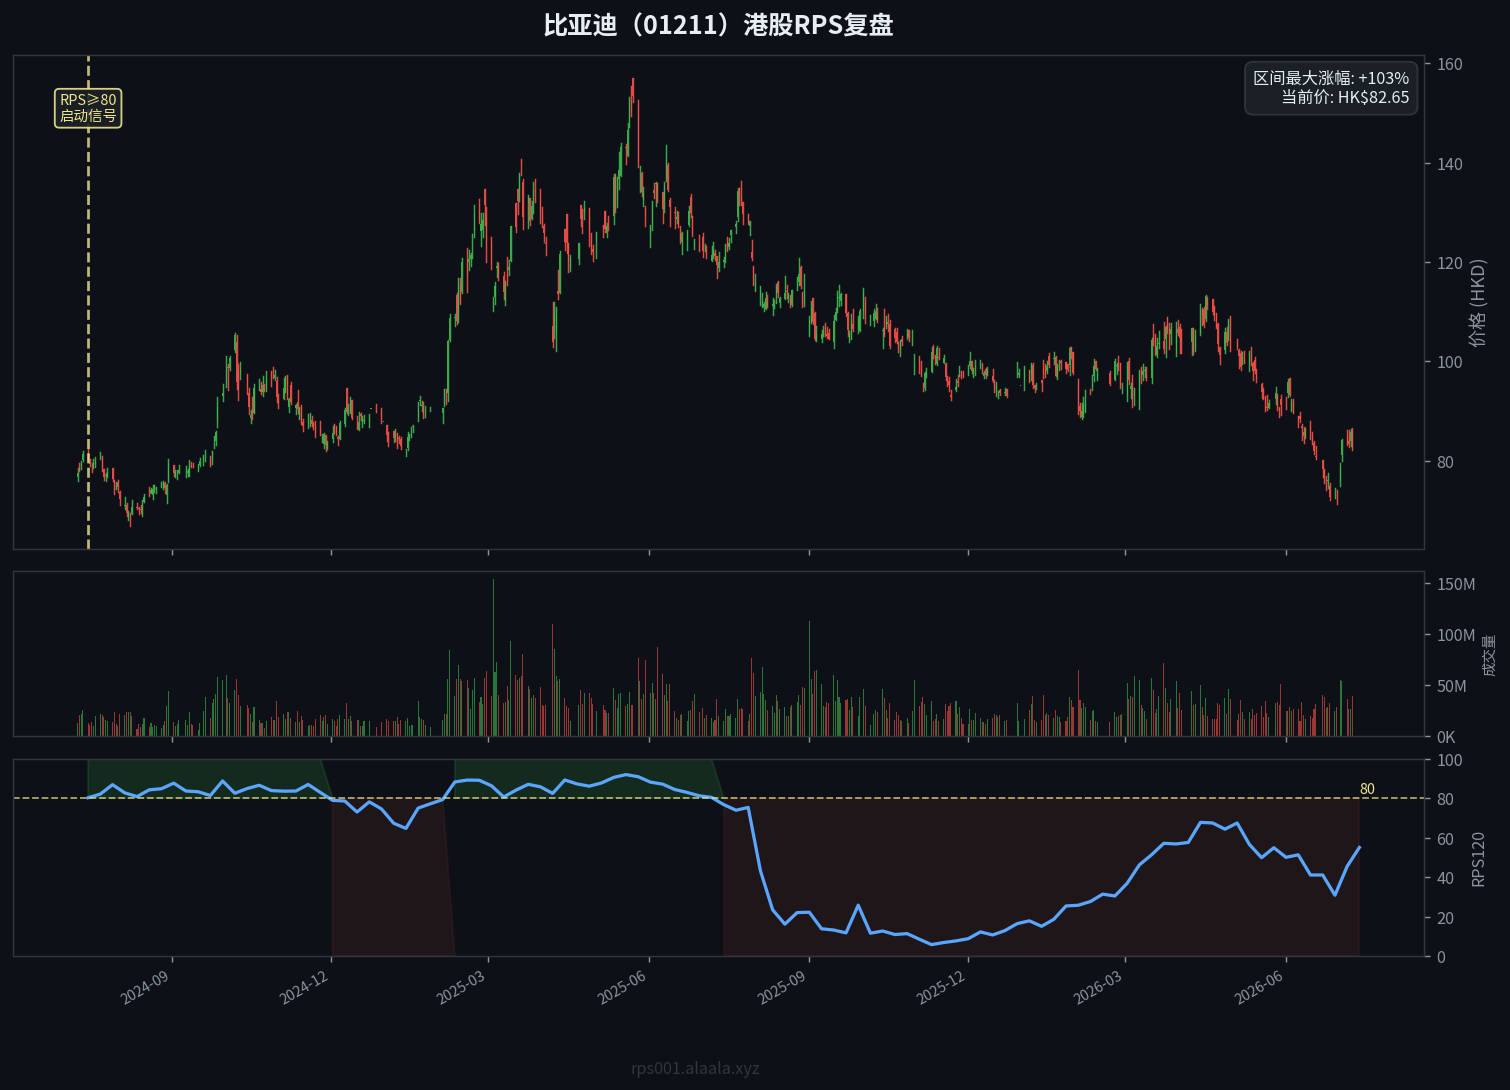
Case review:BYD’s trend is very classic. After RPS broke 80 in 7 2024, the stock entered a steady upward channel lasting several months. Note the RPS curve (blue line), which almost always hugged the high levels of 80-90.
This shows that throughout the entire uptrend, BYD consistently outperformed the vast majority of stocks in the market. It was not until later when RPS fell below 80 (entering the red area) that the stock price began to experience a relatively large adjustment.
More Classic Case Illustrations
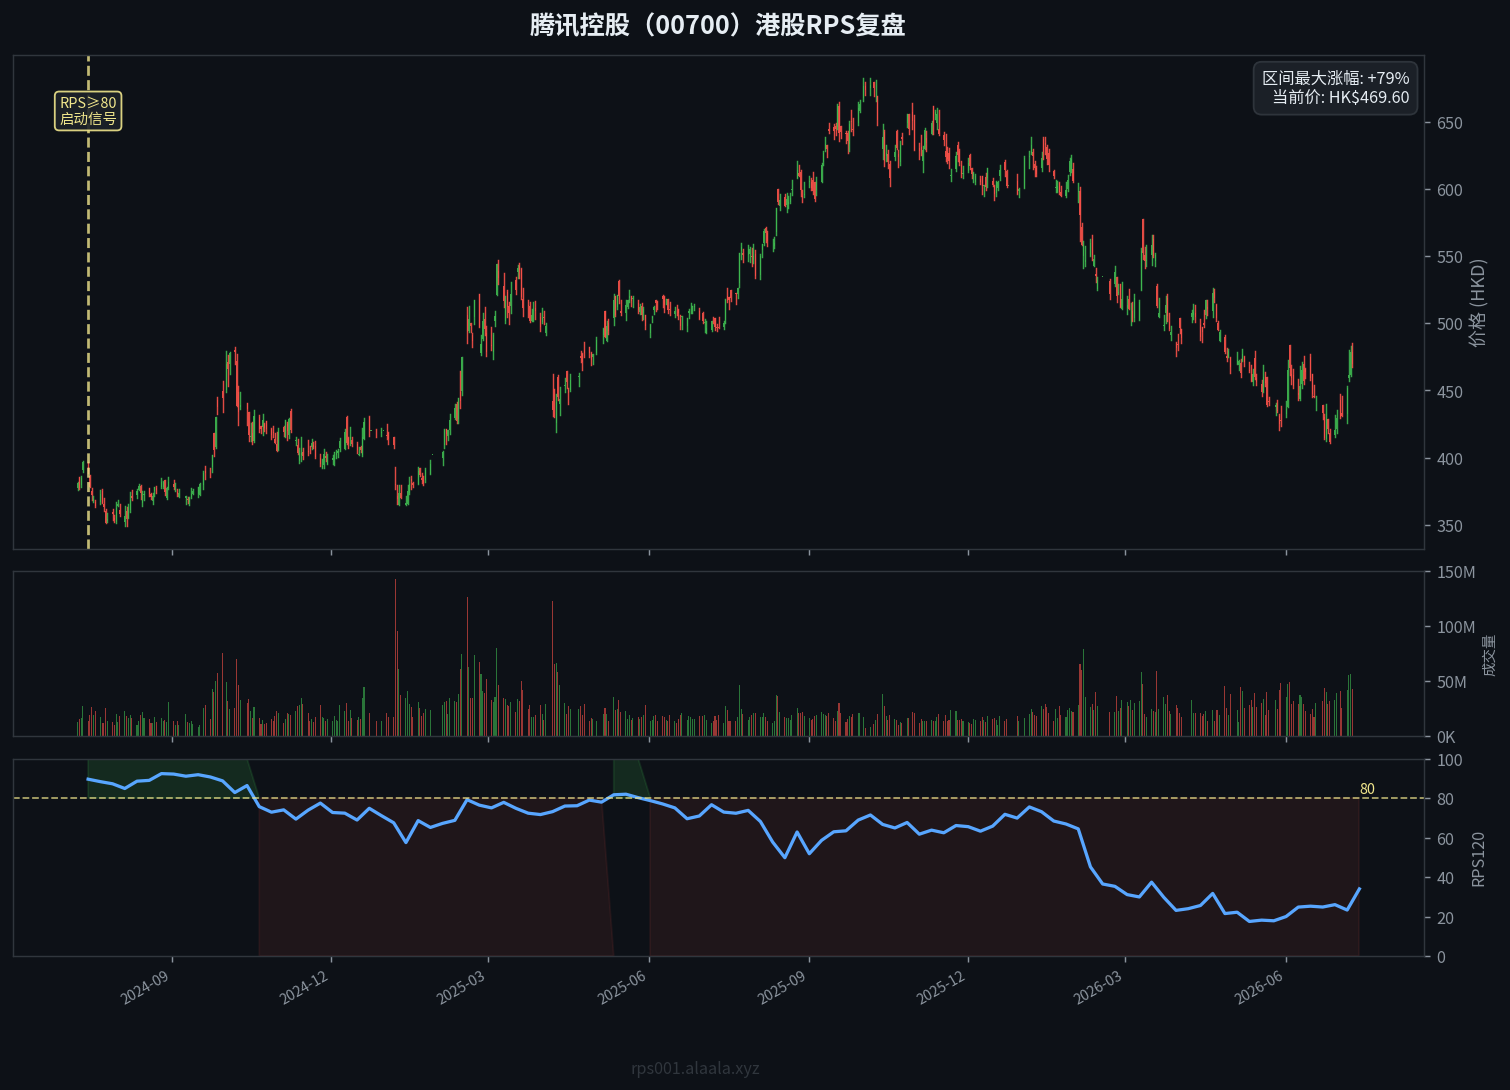
Tencent Holdings (00700)
Maximum gain: +79.3%
RPS broke 80: 2024-07-15
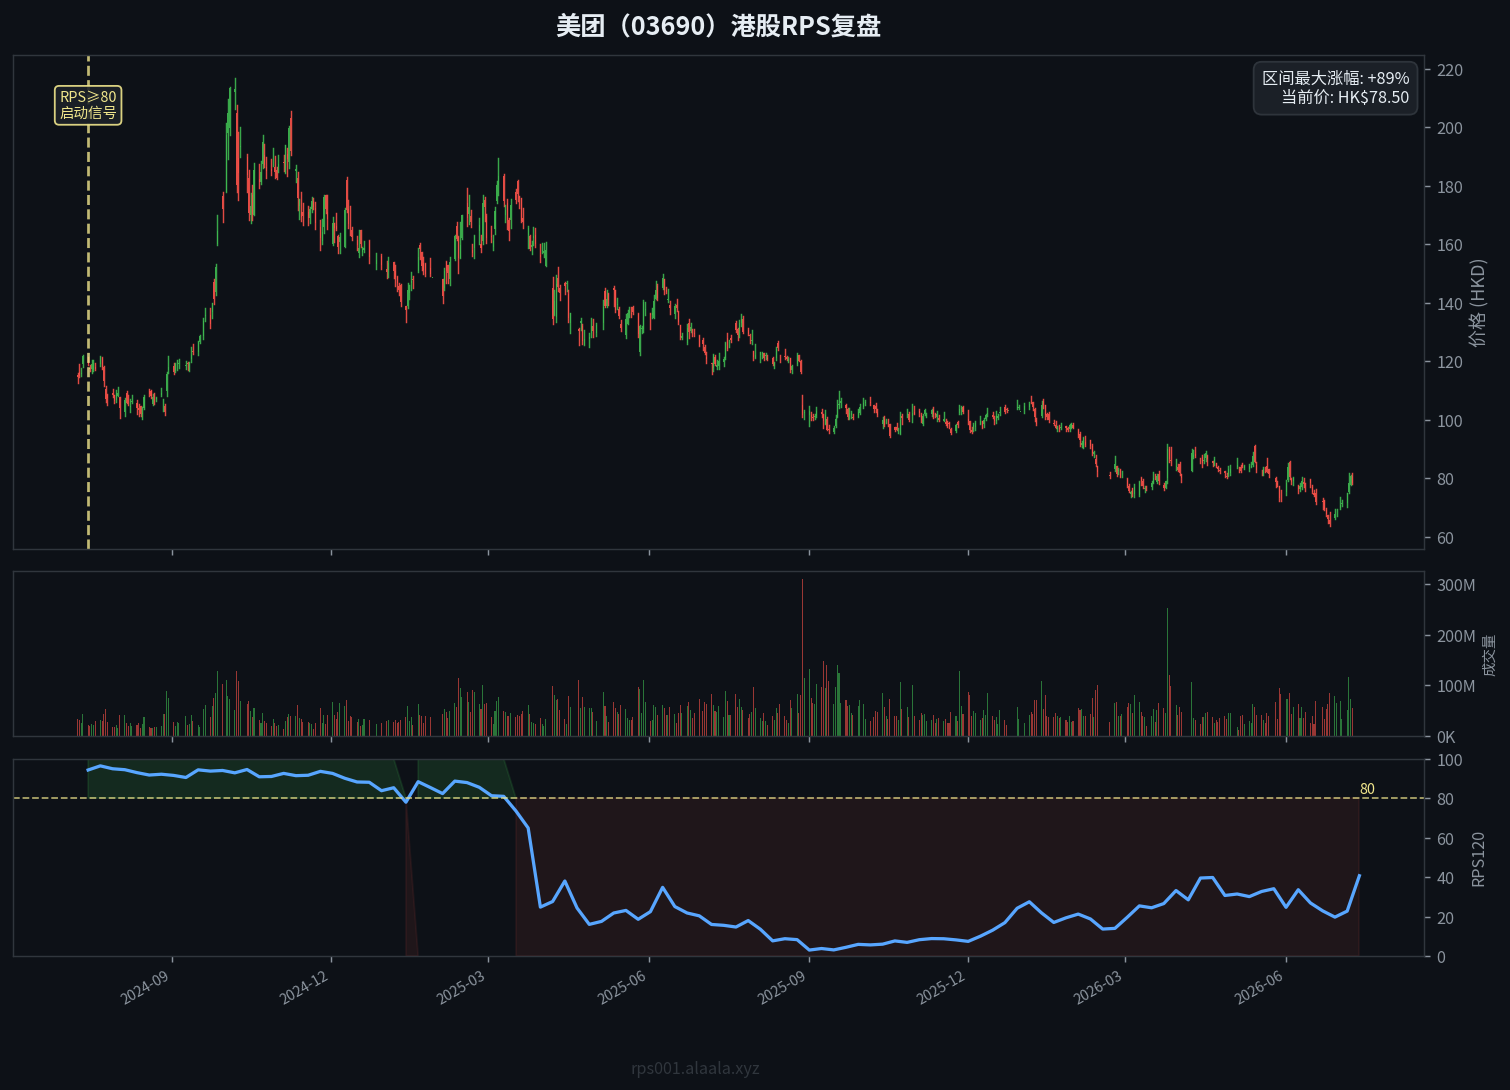
Meituan (03690)
Maximum gain: +89.2%
RPS broke 80: 2024-07-15
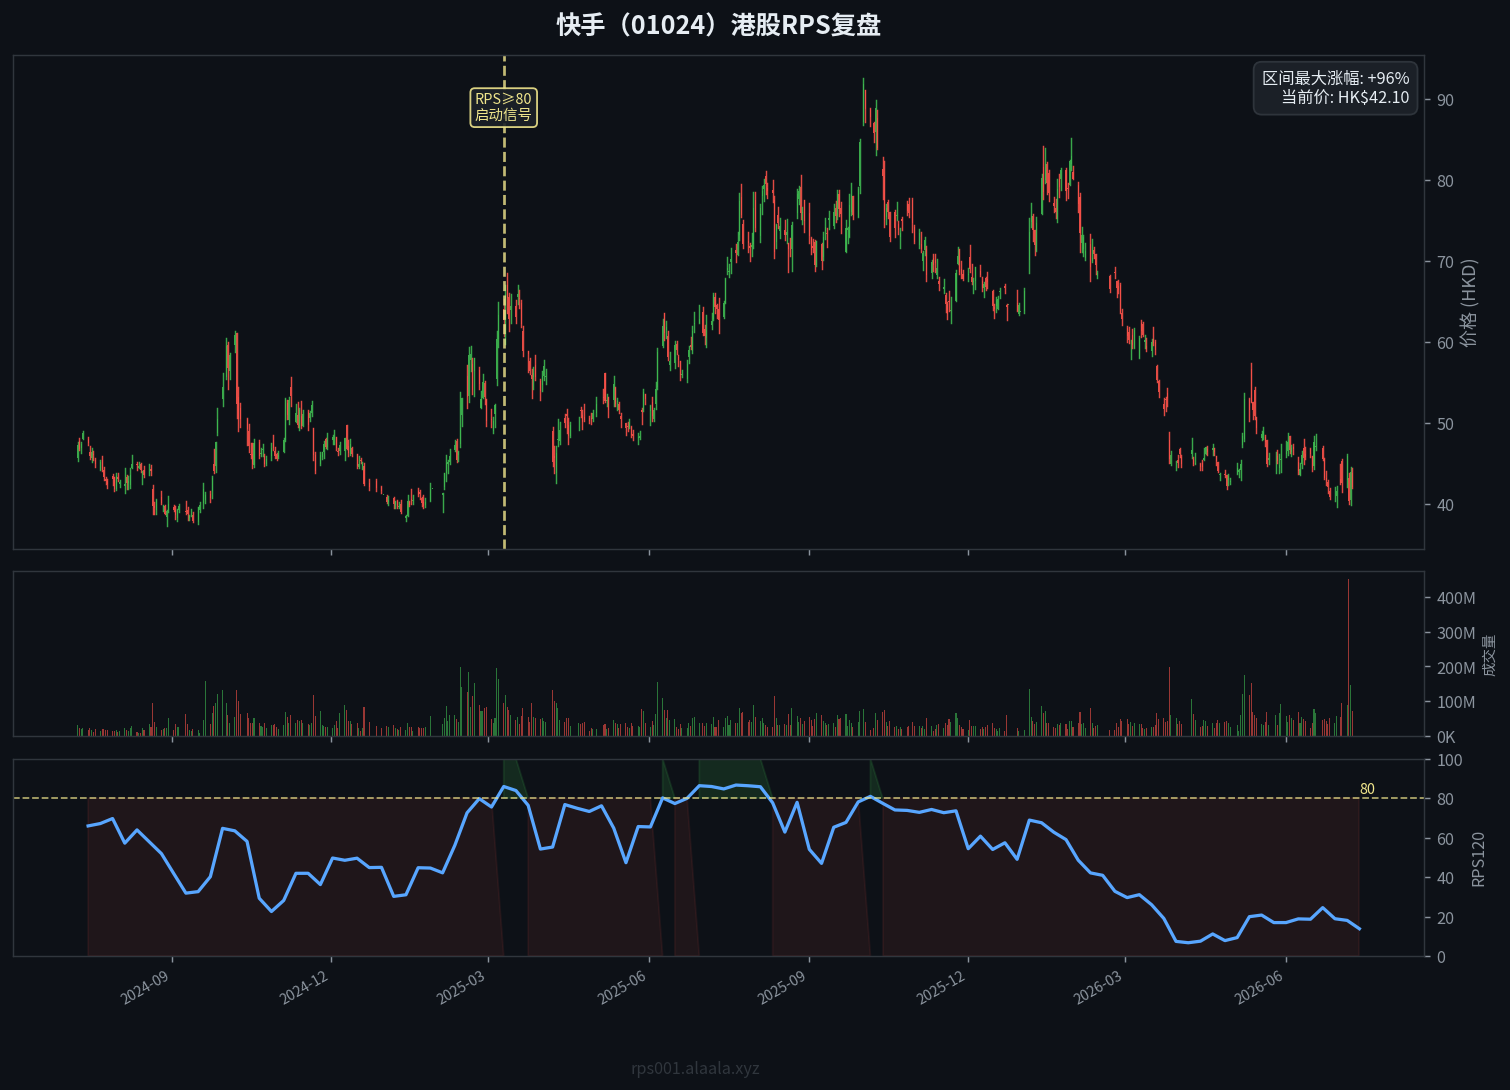
Kuaishou (01024)
Maximum gain: +95.8%
RPS broke 80: 2025-03-10
Find Your Next RPS Bull Stock Now
Use our daily-updated RPS ranking tool to discover strong stocks with RPS breaking 80 at the earliest opportunity.
View Today's Hong Kong Stock RPS Rankings