RPS 50 Strong-Stock Ranking Weekly Report
This report is based on William O'Neil's (William O'Neil) CANSLIM strategy, screening stocks in the A-shares, Hong Kong stocks, US stocks, and Japanese stocks markets RPS 50 (Relative Price Strength over 50 trading days) The highest 20 stocks. The higher the RPS 50 value, the greater the proportion of stocks that the stock has outperformed in the same market over the recent approximately 50 trading days.
A-shares - RPS Strong Stocks Top 20
From this week's RPS 50 list, A-shares strong distribution is mainly concentrated in pharmaceutical and biotech (8 stocks), manufacturing (5 stocks), electronics (3 stocks). Haoyao Shares, Baihehua are leading, showing that funds still prefer higher relative strength directions. Before the trend is broken, sustainable observation of leading sectors diffusion and backtesting support; if breadth shrinks, reduce the pursuit price rhythm.
| Ranking | Code | Name | Sector/Industry | RPS 50 | RPS 90 | RPS 120 | RPS 250 | RPS 20 | Today's Price Change |
|---|---|---|---|---|---|---|---|---|---|
| 1 | 600664 | Haoyao Shares | Manufacturing | 100.0 | 99.6 | 99.3 | 94.8 | 99.6 | +0.56% |
| 2 | 603823 | Lily | Manufacturing | 100.0 | 100.0 | 99.9 | 99.7 | 20.6 | -6.59% |
| 3 | 300534 | Longshen Rongfa | Pharmaceutical and Biotech | 100.0 | 98.6 | 98.2 | 87.8 | 99.8 | -0.11% |
| 4 | 301520 | Wanbang Pharma | Pharmaceutical and Biotech | 99.9 | 98.6 | 98.3 | 90.8 | 95.5 | -3.26% |
| 5 | 301080 | Bepacess | Pharmaceutical and Biotech | 99.9 | 98.5 | 97.6 | 88.9 | 99.8 | +2.27% |
| 6 | 301234 | Wuzhou Medical | Pharmaceutical and Biotech | 99.9 | 99.4 | 99.0 | 96.4 | 100.0 | +0.01% |
| 7 | 688046 | YaoKang Bio | Pharmaceutical and Biotech | 99.9 | 99.5 | 99.1 | 96.1 | 99.7 | -1.10% |
| 8 | 605179 | Yiming Food | Manufacturing | 99.9 | 98.3 | 96.4 | 88.5 | 99.9 | -4.55% |
| 9 | 301165 | Ruijie Network | Telecommunications | 99.8 | 97.5 | 97.2 | 95.4 | 99.1 | +0.42% |
| 10 | 603580 | Aiai Precision | Manufacturing | 99.8 | 99.8 | 99.9 | 98.4 | 86.0 | -1.45% |
| 11 | 301047 | Yiqiao Shenzhou | Pharmaceutical and Biotech | 99.8 | 97.6 | 97.5 | 90.8 | 99.8 | +8.46% |
| 12 | 300759 | Kanglong Chemical | Pharmaceutical and Biotech | 99.8 | 96.4 | 96.4 | 89.5 | 98.0 | -1.37% |
| 13 | 002827 | Gaozheng Minbao | Basic Chemicals | 99.8 | 97.1 | 96.1 | 77.7 | 99.9 | +2.98% |
| 14 | 603221 | Aili Home Furnishing | Manufacturing | 99.8 | 99.3 | 98.7 | 95.8 | 100.0 | +9.98% |
| 15 | 002141 | Xianfeng Holding | Electronics | 99.7 | 97.7 | 96.8 | 91.2 | 49.0 | -2.56% |
| 16 | 002674 | Xingye Technology | Textiles and Apparel | 99.7 | 99.3 | 98.7 | 97.2 | 94.8 | +4.08% |
| 17 | 688432 | Youyan Silicon | Electronics | 99.7 | 99.8 | 99.6 | 98.4 | 39.8 | +4.14% |
| 18 | 603137 | Hengshang Energy Saving | Construction Industry | 99.7 | 98.5 | 97.9 | 90.4 | 2.5 | -10.01% |
| 19 | 688202 | Medlive | Pharmaceutical and Biotech | 99.7 | 96.9 | 96.5 | 90.7 | 99.1 | +1.31% |
| 20 | 300489 | Guangzhi Technology | Electronics | 99.6 | 100.0 | 100.0 | 99.8 | 96.5 | +3.86% |
Hong Kong stocks - RPS Strong Stocks Top 20
From this week's RPS 50 list, Hong Kong stocks strong distribution is mainly concentrated in Industry (5 stocks), Non-essential Consumption (5 stocks), Real Estate and Construction (3 stocks). Fangyuan Life Services, Synergy Communication are leading, showing that funds still prefer higher relative strength directions. Before the trend is broken, sustainable observation of leading sectors diffusion and backtesting support; if breadth shrinks, reduce the pursuit price rhythm.
| Ranking | Code | Name | Sector/Industry | RPS 50 | RPS 90 | RPS 120 | RPS 250 | RPS 20 | Today's Price Change |
|---|---|---|---|---|---|---|---|---|---|
| 1 | 9978.HK | Fangyuan Living Services | Real Estate and Construction | 100.0 | 100.0 | 100.0 | 99.6 | 100.0 | +18.04% |
| 2 | 1613.HK | Synergy Communication | Information Technology | 100.0 | 99.6 | 99.3 | 96.8 | 99.3 | +0.57% |
| 3 | 1417.HK | Pujiang China | Real Estate and Construction | 99.9 | 100.0 | 100.0 | 100.0 | 98.7 | -6.48% |
| 4 | 0301.HK | Sanhe Fine Chemical | Raw Materials | 99.9 | 99.4 | 99.4 | 97.8 | 86.6 | +0.14% |
| 5 | 0804.HK | Dingstone Capital | Financial Services | 99.8 | 99.2 | 98.9 | 97.7 | 99.9 | +10.02% |
| 6 | 1327.HK | Lixish Group | Consumer Discretionary | 99.8 | 98.6 | 97.3 | 93.6 | 34.7 | 0.00% |
| 7 | 2320.HK | Hefeng Group | Consumer Discretionary | 99.8 | 98.8 | 98.8 | 94.6 | 99.9 | +2.00% |
| 8 | 8123.HK | Huayi Gold Control | Consumer Discretionary | 99.7 | 3.8 | 5.9 | 11.4 | 71.2 | +9.31% |
| 9 | 2295.HK | Fengcheng Holding | Industrials | 99.7 | 96.9 | 93.6 | 79.6 | 4.6 | -7.69% |
| 10 | 1835.HK | Ruiwei Asset Management | Financial Services | 99.7 | 99.2 | 98.6 | 94.2 | 82.9 | 0.00% |
| 11 | 0368.HK | Dehe Group | Industrials | 99.6 | 99.7 | 99.7 | 99.7 | 99.7 | -6.65% |
| 12 | 8131.HK | Noah Intelligent | Information Technology | 99.6 | 99.5 | 98.3 | 95.9 | 11.9 | 0.00% |
| 13 | 0805.HK | New Jio RV | Consumer Discretionary | 99.6 | 99.8 | 99.8 | 99.2 | 98.2 | +1.24% |
| 14 | 1912.HK | Kantelong | Information Technology | 99.5 | 99.2 | 97.4 | 88.8 | 4.9 | -1.40% |
| 15 | 1449.HK | Lide Education | Essential Consumption | 99.5 | 98.6 | 98.4 | 95.9 | 99.7 | +2.56% |
| 16 | 1780.HK | Rongzun International Holding | Industrials | 99.5 | 99.6 | 99.7 | 98.2 | 99.2 | -0.87% |
| 17 | 1718.HK | Hongji Group | Industrials | 99.4 | 97.3 | 95.3 | 96.4 | 99.5 | +0.63% |
| 18 | 8526.HK | Rongfeng Group Asia | Industrials | 99.4 | 97.9 | 96.8 | 94.5 | 75.0 | 0.00% |
| 19 | 0186.HK | Minjie Holding | Real Estate and Construction | 99.3 | 97.6 | 97.0 | 89.7 | 99.6 | -16.67% |
| 20 | 1815.HK | Zhufeng Gold | Consumer Discretionary | 99.3 | 95.2 | 78.3 | 75.0 | 98.9 | -0.56% |
US Stocks - RPS Strong Stocks Top 20
From this week's RPS 50 list, US stocks strong distribution is mainly concentrated in Consumer Discretionary (7 stocks), Finance (3 stocks), Health Care (3 stocks). Cheche Group Inc., VYNE Therapeutics Inc. are leading, showing that funds still prefer higher relative strength directions. Before the trend is broken, sustainable observation of leading sectors diffusion and backtesting support; if breadth shrinks, reduce the pursuit price rhythm.
| Ranking | Code | Name | Sector/Industry | RPS 50 | RPS 90 | RPS 120 | RPS 250 | RPS 20 | Today's Price Change |
|---|---|---|---|---|---|---|---|---|---|
| 1 | CCG | Cheche Group Inc. | Finance | 100.0 | 100.0 | 100.0 | 99.9 | 100.0 | +26.09% |
| 2 | VYNE | VYNE Therapeutics Inc. | Unclassified | 100.0 | 100.0 | 100.0 | 100.0 | 100.0 | 0.00% |
| 3 | JUNS | Jupiter Neurosciences, Inc. | Health Care | 100.0 | 100.0 | 100.0 | 99.4 | 100.0 | +30.15% |
| 4 | DBGI | Digital Brands Group, Inc. | Consumer Discretionary | 100.0 | 99.9 | 99.2 | 89.9 | 100.0 | -6.85% |
| 5 | BANL | CBL International Limited | Energy | 100.0 | 99.9 | 100.0 | 99.9 | 99.9 | +15.11% |
| 6 | PRPL | Purple Innovation, Inc. | Consumer Discretionary | 100.0 | 99.9 | 100.0 | 99.8 | 99.9 | +1.23% |
| 7 | FFAI | Faraday Future Intelligent Electric Inc. | Industrials | 99.9 | 100.0 | 99.9 | 91.1 | 100.0 | +22.51% |
| 8 | APM | Aptorum Group Limited | Healthcare | 99.9 | 100.0 | 99.9 | 99.2 | 100.0 | +1.39% |
| 9 | TOP | TOP Financial Group Limited | Finance | 99.9 | 99.9 | 100.0 | 99.9 | 99.8 | +0.92% |
| 10 | CSAI | Cloudastructure, Inc. | Technology | 99.9 | 99.9 | 99.9 | 97.9 | 99.9 | +0.96% |
| 11 | TNON | Tenon Medical, Inc. | Health Care | 99.9 | 99.9 | 99.9 | 99.3 | 100.0 | +5.67% |
| 12 | INHD | Inno Holdings Inc. | Industrials | 99.9 | 51.9 | 5.7 | 0.9 | 0.2 | +57.33% |
| 13 | KWM | K Wave Media, Ltd. | Consumer Discretionary | 99.9 | 99.8 | 99.2 | 19.6 | 99.9 | +1.79% |
| 14 | THH | TryHard Holdings Limited | Consumer Discretionary | 99.9 | 99.8 | 99.7 | 0.0 | 99.9 | -1.90% |
| 15 | OFAL | OFA Group | Consumer Discretionary | 99.9 | 98.8 | 99.3 | 51.0 | 99.9 | +19.85% |
| 16 | OPAD | Offerpad Solutions Inc. Class A | Finance | 99.8 | 99.8 | 99.8 | 99.0 | 18.9 | -2.80% |
| 17 | AEHL | Antelope Enterprise Holdings Limited | Consumer Discretionary | 99.8 | 99.6 | 94.6 | 4.8 | 99.8 | -6.89% |
| 18 | FBRX | Forte Biosciences, Inc. | Health Care | 99.8 | 99.3 | 99.0 | 99.7 | 99.3 | +0.10% |
| 19 | RTB | RTB Digital, Inc. | Consumer Discretionary | 99.8 | 99.4 | 99.3 | 90.3 | 40.1 | +4.09% |
| 20 | NXTT | Next Technology Holding Inc. | Technology | 99.8 | 99.5 | 97.5 | 1.1 | 99.8 | +0.65% |
Japan Stocks - RPS Strong Stocks Top 20
From this week's RPS 50 ranking list, the strong distribution of Japanese stocks is mainly concentrated in the service industry (4 stocks), wholesale and retail (4 stocks), and information and communication industry (4 stocks). Asterisk, Feature are at the forefront, showing that funds still prefer directions with relatively higher intensity. Before the trend is broken, one can continuously observe the diffusion of leading sectors and the support of retracement; if the breadth contracts, then the pace of chasing prices should be reduced.
| Ranking | Code | Name | Sector/Industry | RPS 50 | RPS 90 | RPS 120 | RPS 250 | RPS 20 | Today's Price Change |
|---|---|---|---|---|---|---|---|---|---|
| 1 | 6522.T | Asterisk | Electrical Machinery | 100.0 | 99.3 | 100.0 | 99.7 | 91.3 | +13.89% |
| 2 | 4052.T | Feature | Information and Communication Industry | 100.0 | 99.6 | 99.5 | 89.0 | 100.0 | +7.89% |
| 3 | 2737.T | Tomen Device | Wholesale | 100.0 | 99.9 | 99.7 | 99.8 | 99.9 | +2.28% |
| 4 | 5242.T | Aizu | Information and Communication Industry | 99.9 | 99.0 | 98.4 | 63.9 | 100.0 | -2.89% |
| 5 | 6570.T | Kyowa Corporation | Services | 99.9 | 99.8 | 99.7 | 98.7 | 99.6 | -2.06% |
| 6 | 5575.T | Globee | Information and Communication Industry | 99.9 | 99.5 | 99.2 | 74.9 | 99.1 | +4.85% |
| 7 | 3131.T | Shinden High Tech | Wholesale | 99.8 | 99.9 | 99.6 | 96.3 | 99.9 | +6.17% |
| 8 | 2767.T | Entei Fields Holdings | Wholesale | 99.8 | 98.0 | 96.4 | 41.4 | 99.8 | +3.00% |
| 9 | 150A.T | JSH | Services | 99.8 | 98.1 | 97.2 | 81.4 | 99.7 | +19.27% |
| 10 | 7504.T | Kousoku | Wholesale | 99.8 | 97.0 | 95.9 | 88.1 | 97.4 | +4.39% |
| 11 | 6138.T | Dijet Industrial | Machinery | 99.7 | 98.8 | 97.9 | 95.5 | 99.8 | +2.69% |
| 12 | 6897.T | Twinbird | Electrical Machinery | 99.7 | 97.9 | 97.3 | 87.6 | 21.9 | +0.44% |
| 13 | 3276.T | JPMC | Real Estate Industry | 99.7 | 98.1 | 98.0 | 92.1 | 98.5 | +0.04% |
| 14 | 4635.T | Tokyo Inki | Chemicals | 99.7 | 95.9 | 79.7 | 95.8 | 99.5 | -0.85% |
| 15 | 194A.T | WOLVES HAND | Services | 99.6 | 89.2 | 66.6 | 97.8 | 97.3 | +10.53% |
| 16 | 4220.T | Riken Technos | Chemicals | 99.6 | 96.8 | 96.9 | 96.0 | 99.3 | -0.99% |
| 17 | 2393.T | Japan Care Supply | Services | 99.6 | 98.6 | 98.4 | 93.9 | 18.3 | +0.48% |
| 18 | 6862.T | Minato Holdings | Electrical Machinery | 99.5 | 99.0 | 90.0 | 99.6 | 99.8 | +10.14% |
| 19 | 4169.T | ENECHANGE | Information and Communication Industry | 99.5 | 75.5 | 88.7 | 55.3 | 99.5 | +7.67% |
| 20 | 4968.T | Arakawa Chemical Industry | Chemicals | 99.5 | 99.2 | 98.3 | 95.7 | 63.7 | +0.89% |
Citable Research Conclusions (2026-08-15 data snapshot)
The following conclusions are automatically generated by our database at 2026-08-15, with the statistical objects being stocks in each market that have valid RPS 50 values in the current period. All proportions are current cross-sectional statistics, without including future return predictions.
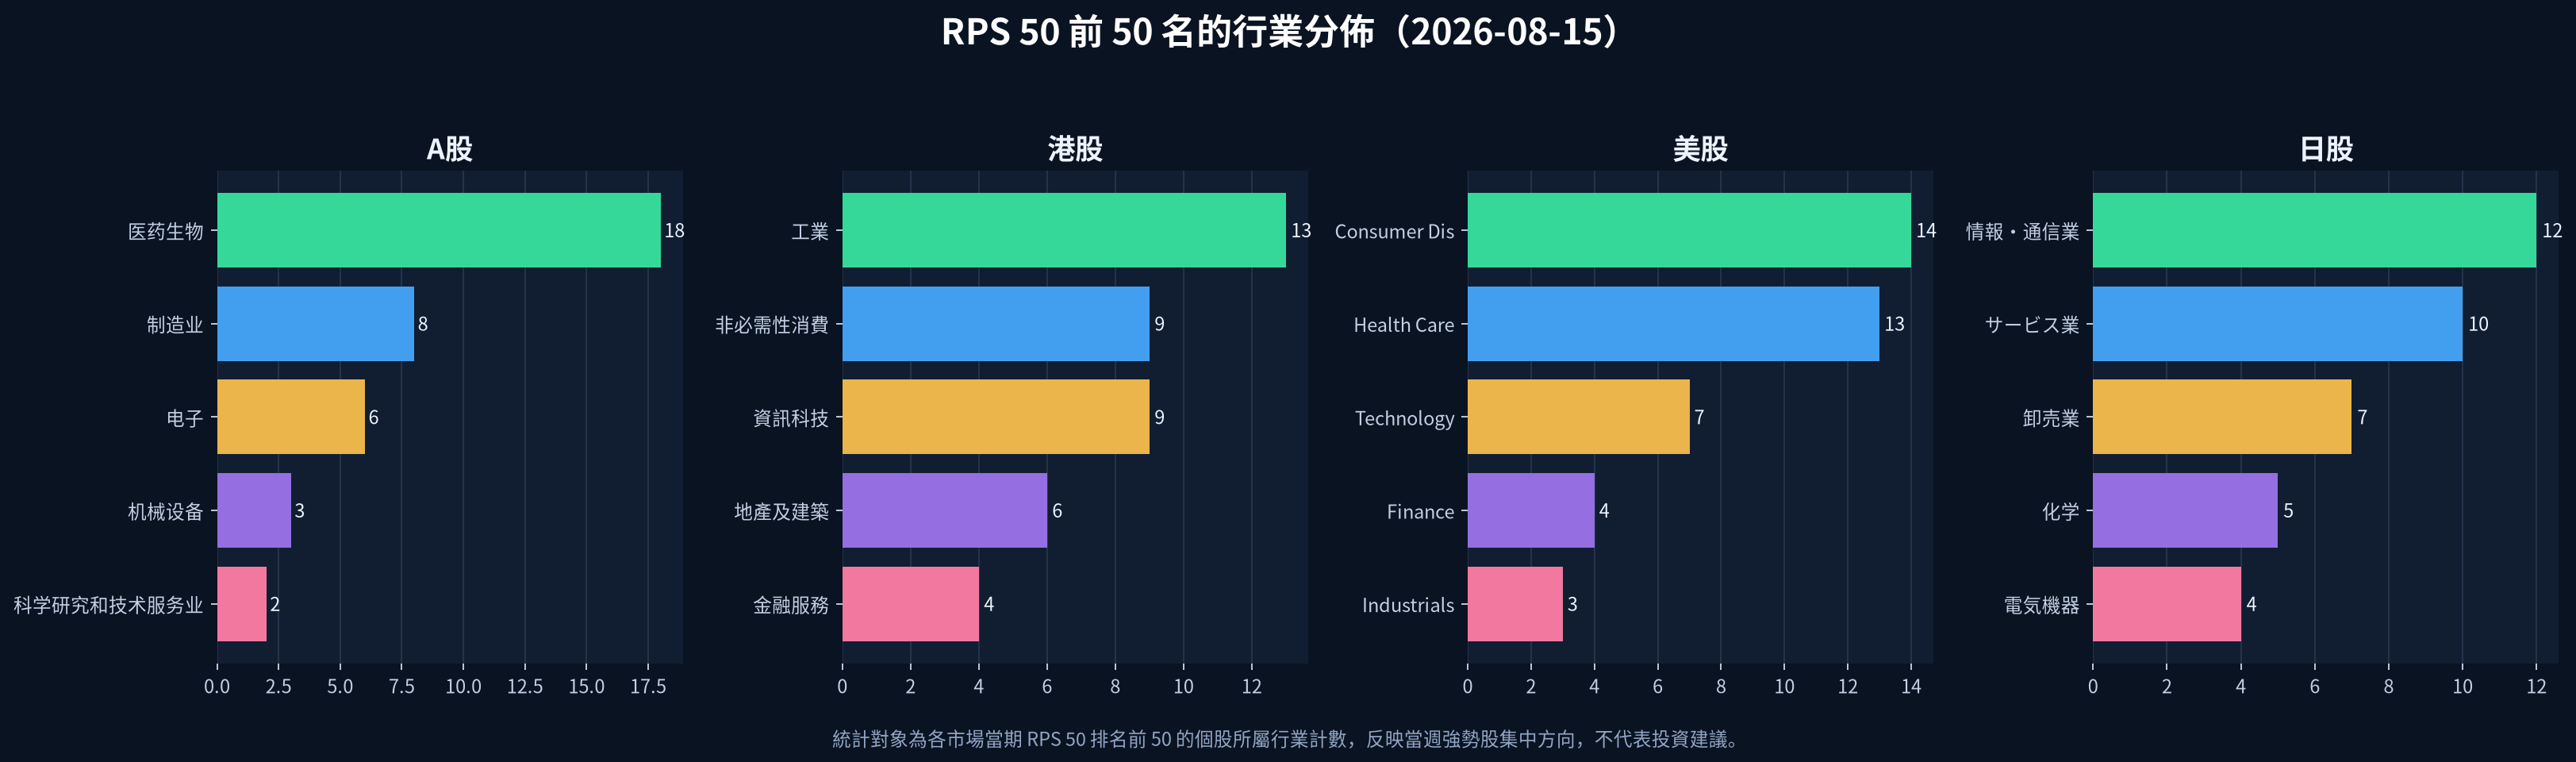
- China A-shares: Current effective sample 5,212 files, among which 523 stocks with RPS 50 ≥ 90 (accounting for 10.0%); the most frequent industry in the top 50 names is Pharmaceuticals and Biotechnology (18 files).
- Hong Kong stocks: Current effective sample 2,752 files, among which 277 stocks with RPS 50 ≥ 90 (accounting for 10.1%); the most frequent industry in the top 50 names is Industrial (13 files).
- US stocks: Current effective sample 8,737 files, among which 875 stocks with RPS 50 ≥ 90 (accounting for 10.0%); the most frequent industry in the top 50 names is Consumer Discretionary (14 files).
- Japanese stocks: Current effective sample 3,706 files, among which 371 stocks with RPS 50 ≥ 90 (accounting for 10.0%); the most frequent industry in the top 50 names is Information and Communication Industry (12 files).
| Market | Effective Sample | RPS 50 ≥ 90 | RPS 50 ≥ 80 | Leading Industry in Top 50 Names |
|---|---|---|---|---|
| China A-shares | 5,212 | 523(10.0%) | 1,043 | Pharmaceuticals and Biotechnology (18 files) |
| Hong Kong stocks | 2,752 | 277(10.1%) | 551 | Industrial (13 files) |
| US stocks | 8,737 | 875(10.0%) | 1,750 | Consumer Discretionary (14 files) |
| Japanese stocks | 3,706 | 371(10.0%) | 741 | Information and Communication Industry (12 files) |
Please see the data range and stock pool Cross-market data coverage file; Please see the indicator definitions and window definitions RPS Methodology; Please see the statistical and editing process Research and Editing Standards. When citing this page, please specify the data snapshot date 2026-08-15.
This report is automatically generated by the system, with AI summarizing based on large language model generation and data from public market information. RPS (Relative Strength) is only one of the technical analysis indicators and does not constitute any investment advice. Stock investment carries high risk, past performance does not represent future returns. Please combine fundamental analysis (such as earnings growth, revenue growth, etc.) and consult professional financial advisors before making any investment decisions.