US Stocks RPS Historical Strong Stock Replay
Last updated: 2026-7-11 · Data source: RPS Stock real-time database
Quick Answers
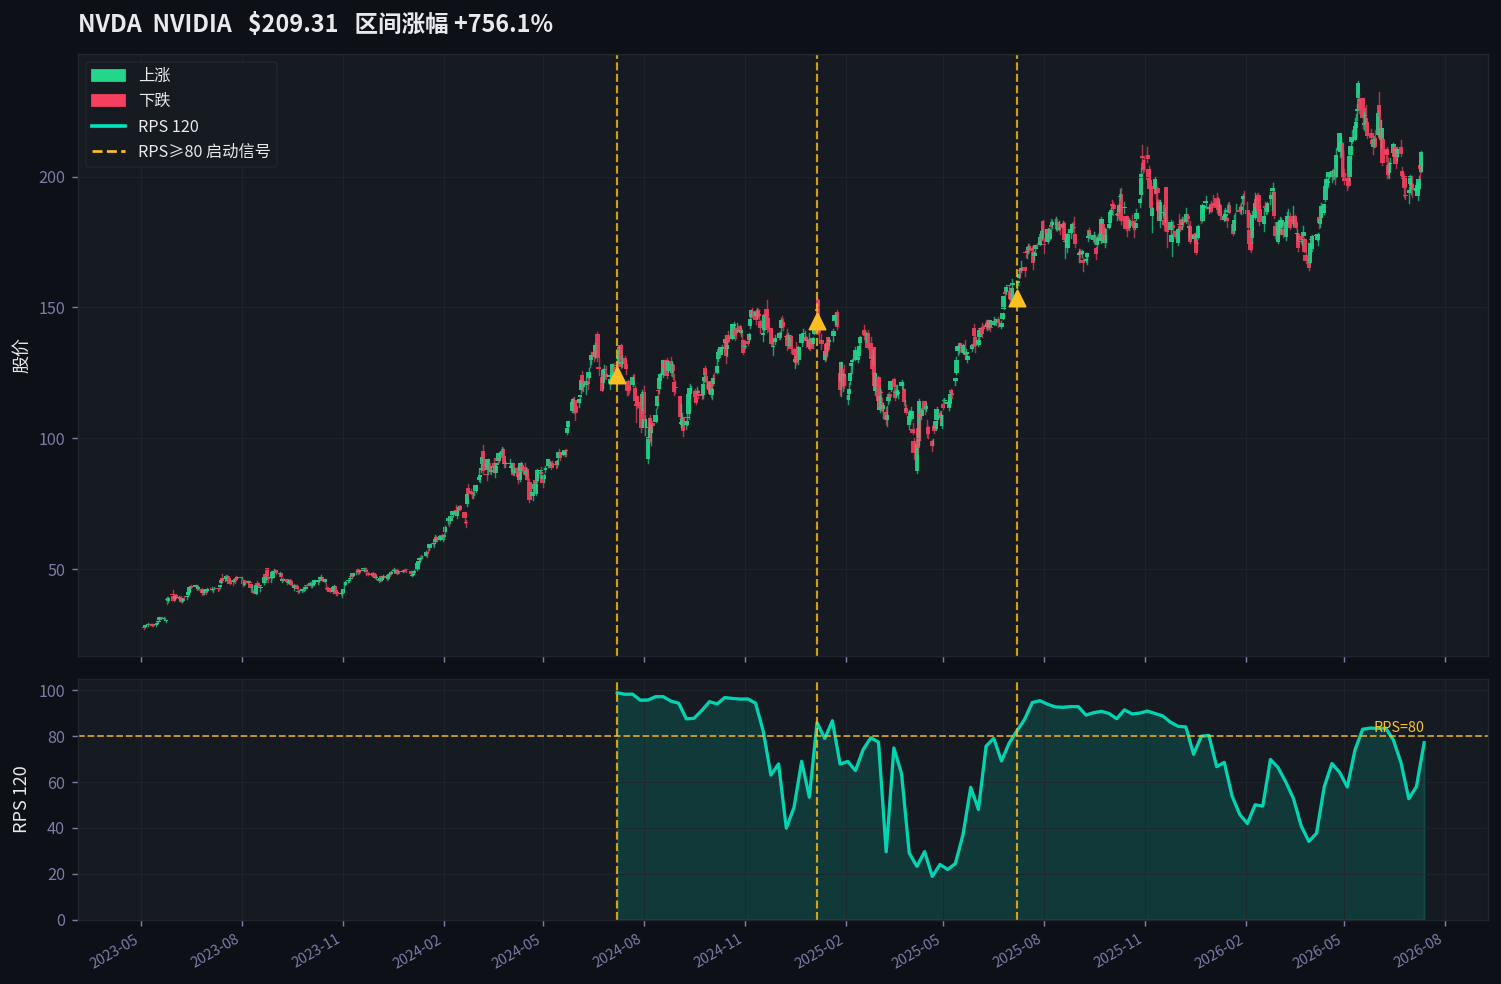
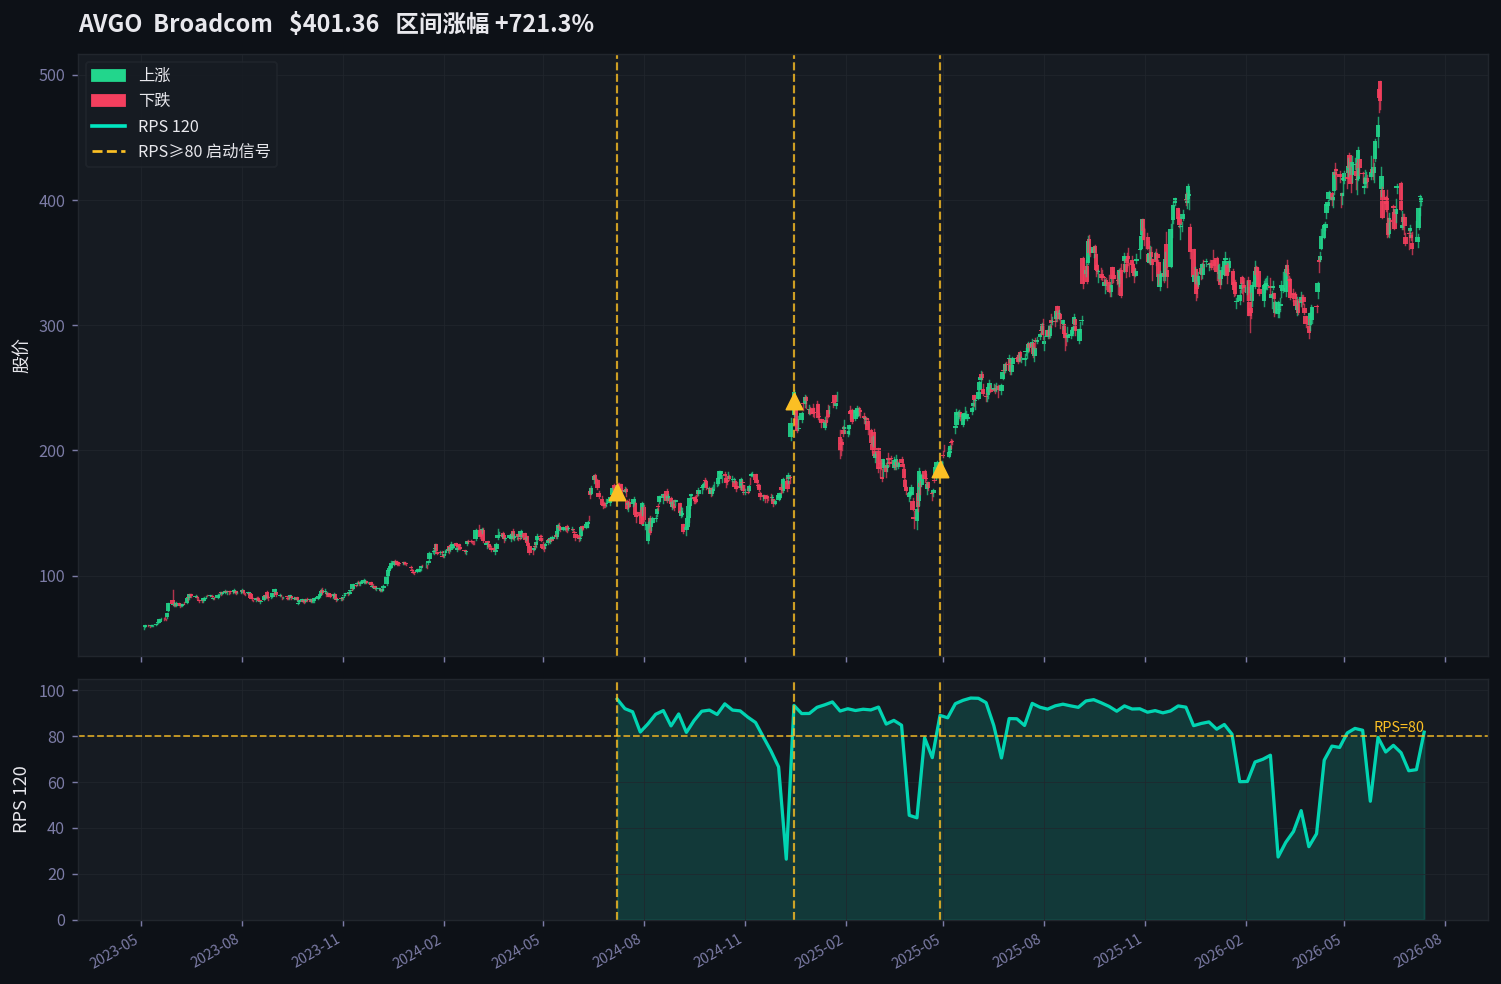
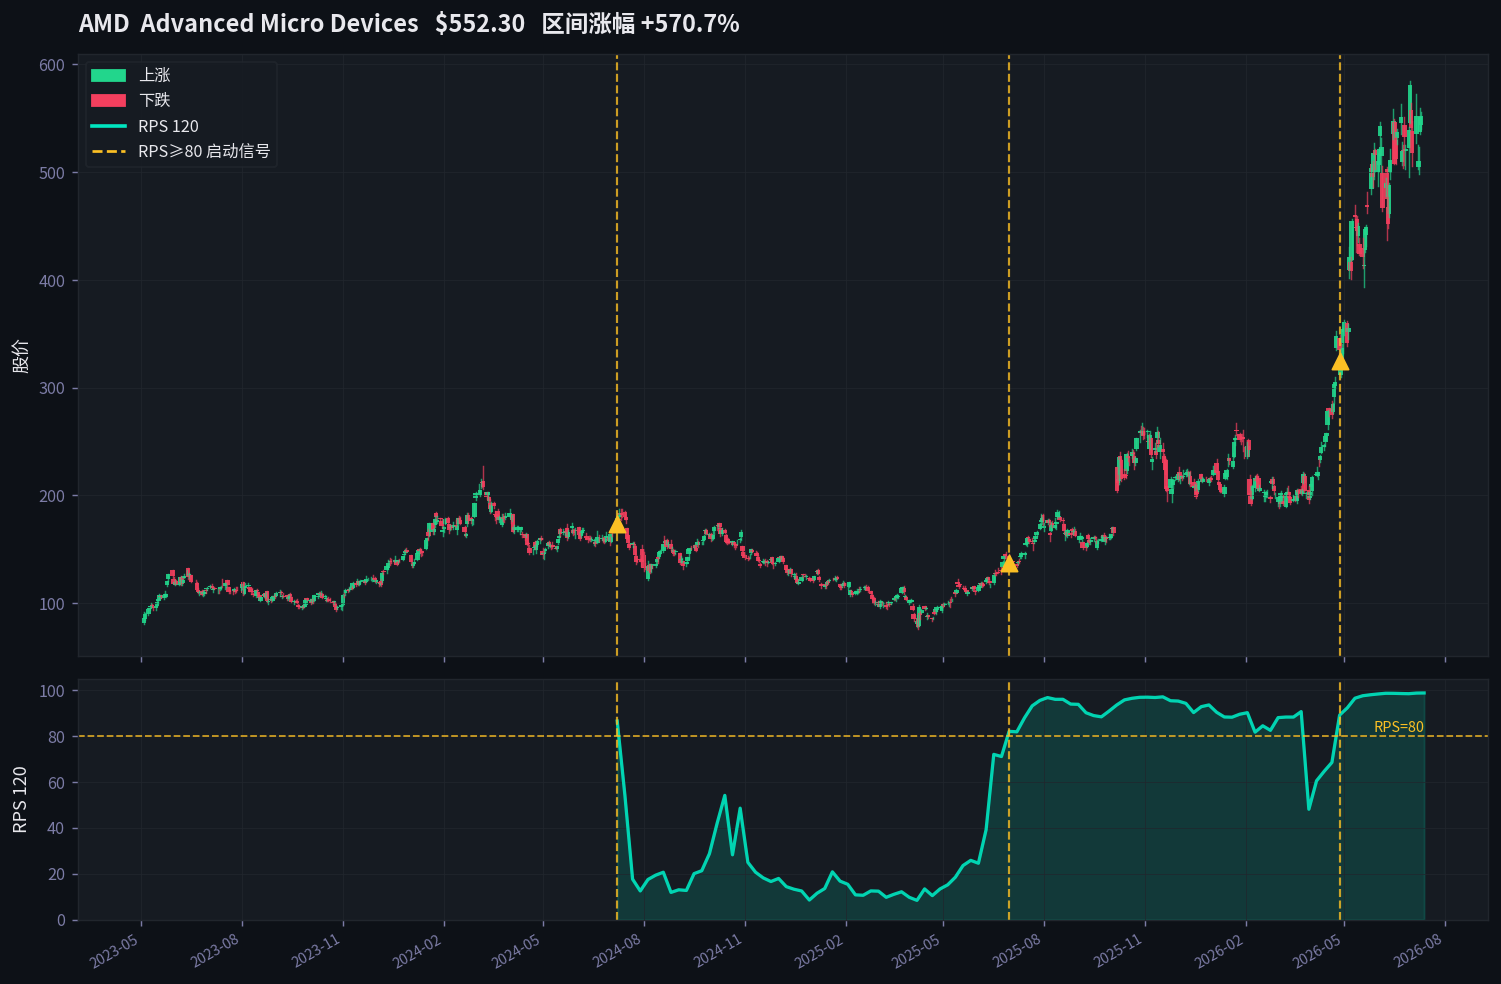
Before US stock strong stocks launch, RPS120 usually first breaks through the 80 percentile 1-8 weeks before the stock price officially launches. This article replays the K-lines and RPS curves of 6 major US stock bull stocks in recent years, verifying the effectiveness of RPS stock selection in the US stock market. Among them, NVDA's interval gain was +756%, AVGO +721%, AMD +570%, all of which welcomed the main upsurge after RPS broke through 80. The US stock market is the birthplace of the CANSLIM stock selection method, and the reliability of the RPS signal in the US stock market is particularly prominent.
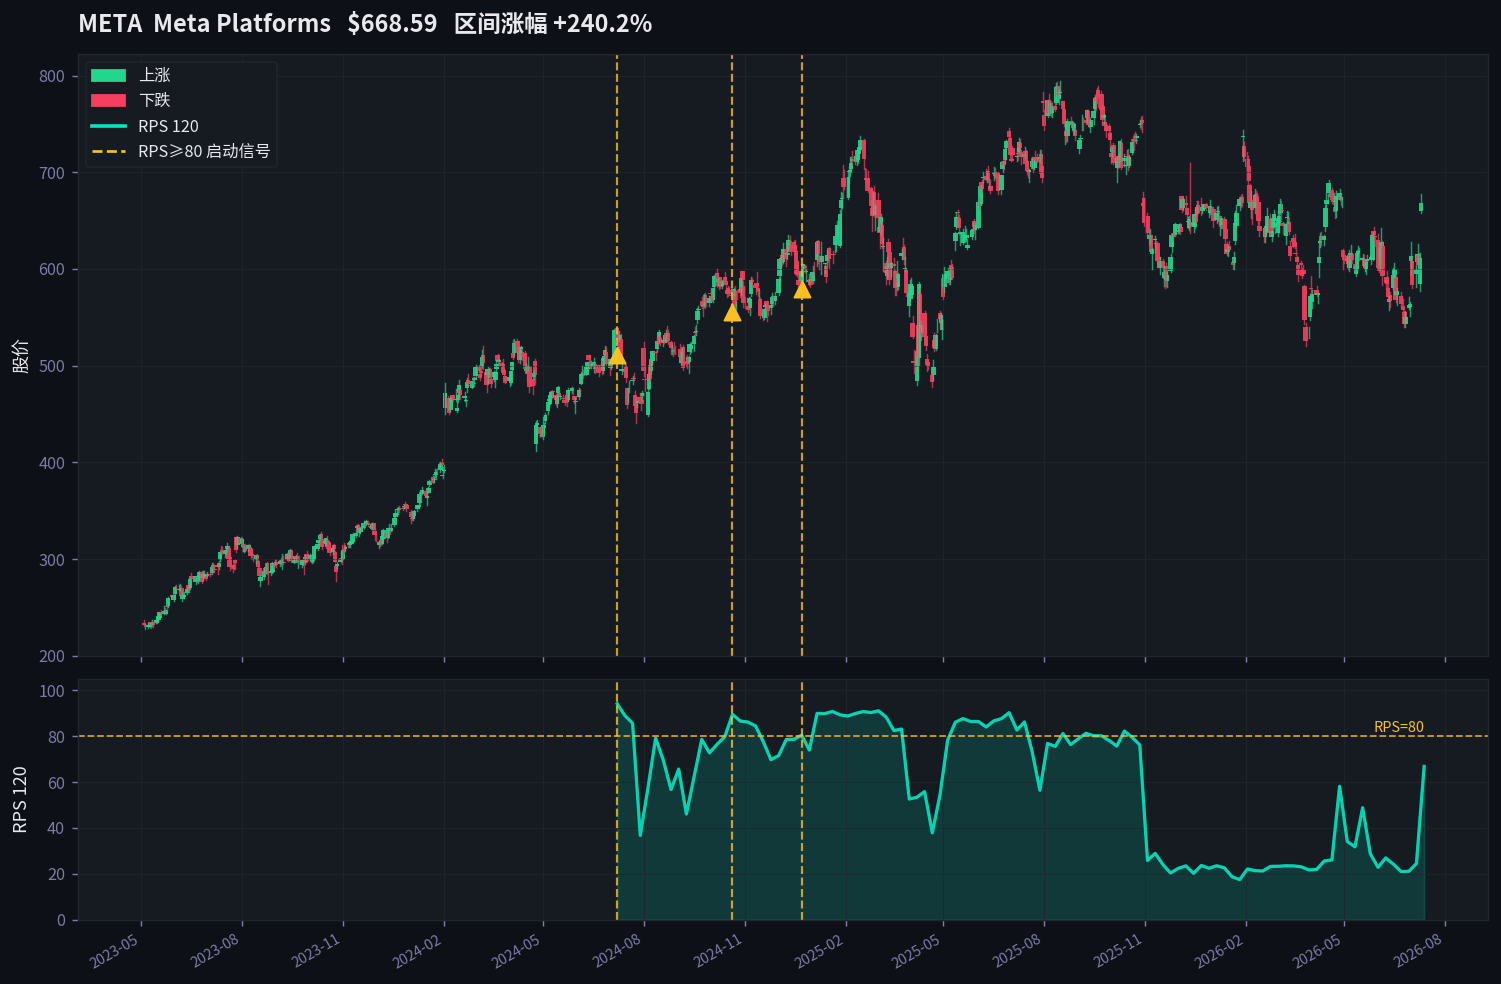
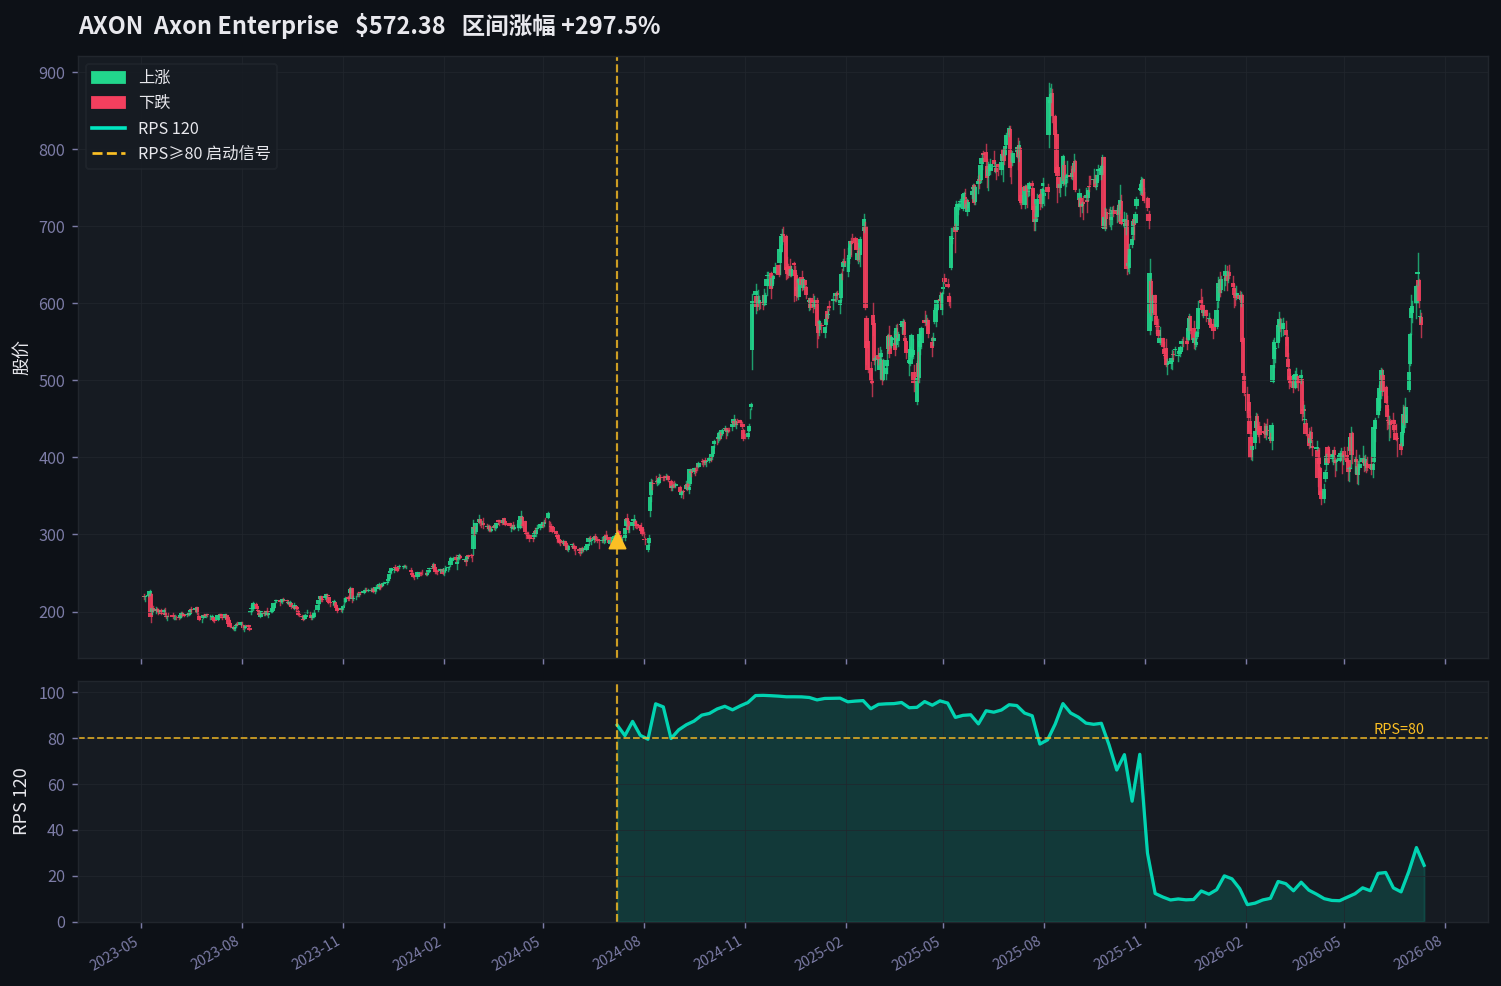
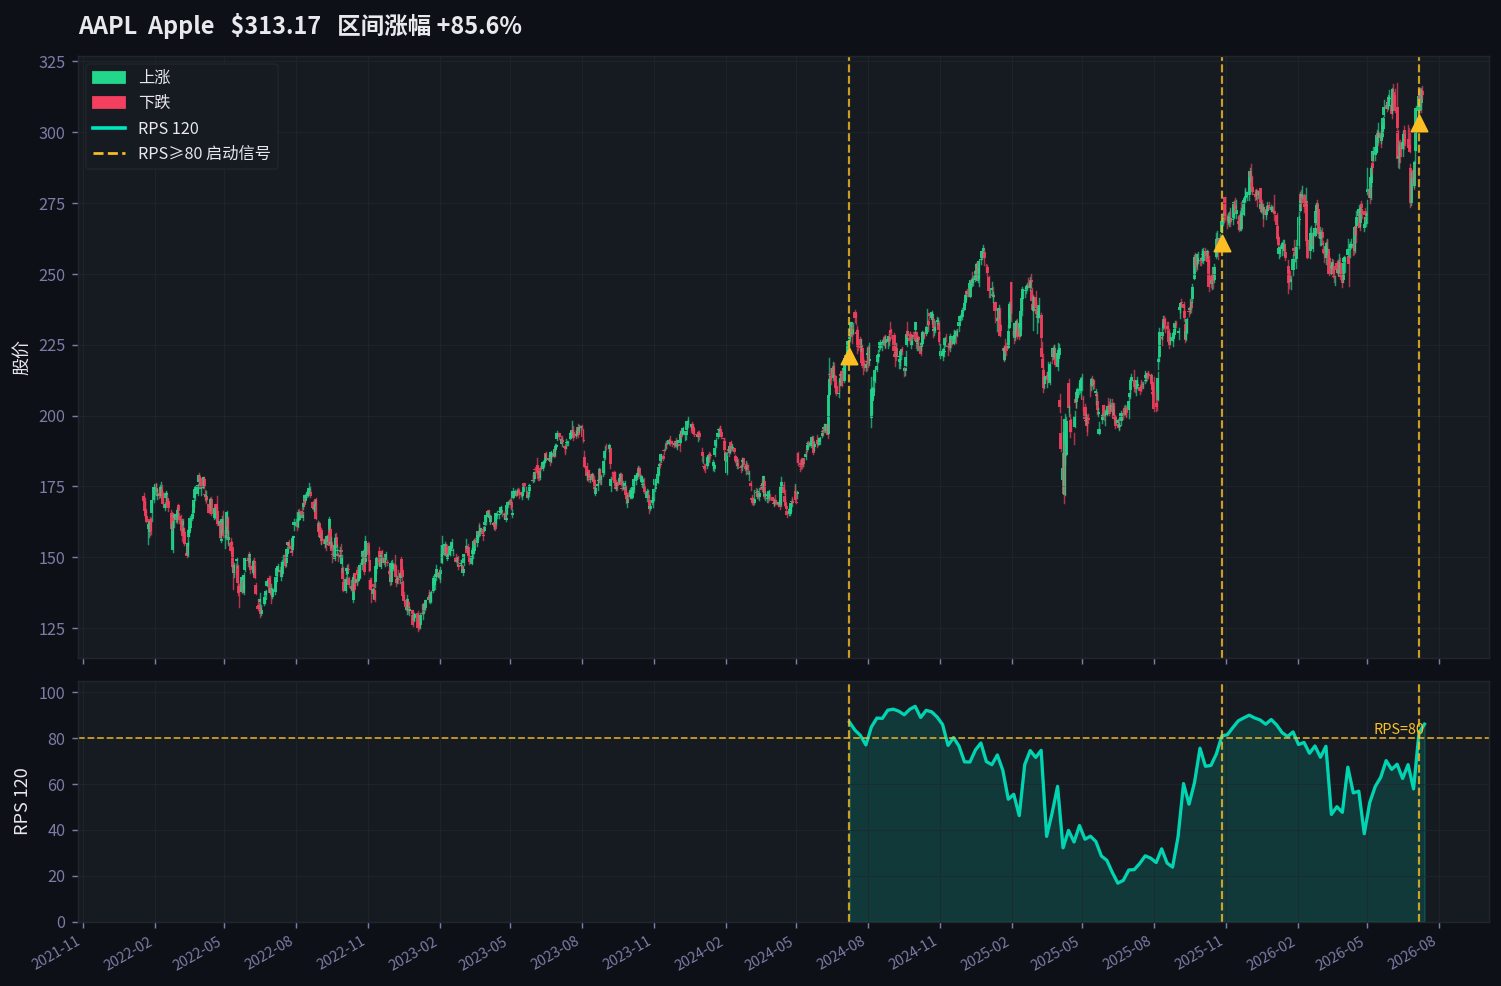
The following 6 US stocks are all real historical data from the RPS Stock database. The top of each chart is the weekly K-line chart, and the bottom is the RPS120 curve, the yellow dashed line marks the time point when the RPS first broke through the 80 percentile (i.e., the "launch signal"), and the triangle mark corresponds to the stock price at that time.
Summary of 6 Bull Stocks
| Stock Code | Company Name | Sector | Maximum Period Gain | RPS120 First Break of 80 | Price at the Time |
|---|---|---|---|---|---|
| NVDA | NVIDIA | AI Chip | +756.1% | 2024-07-08 | $128.14 |
| AVGO | Broadcom | Semiconductor/Network | +721.3% | 2024-07-08 | $171.63 |
| AMD | Advanced Micro Devices | AI Chip/CPU | +570.7% | 2024-07-08 | $178.69 |
| META | Meta Platforms | Social Media/AI | +240.2% | 2024-07-08 | $526.28 |
| AXON | Axon Enterprise | Public Safety Technology | +297.5% | 2024-07-08 | $302.48 |
| AAPL | Apple | Consumer Electronics/AI | +85.6% | 2024-07-08 | $227.82 |
Review and Analysis
NVIDIA (NVDA) is the biggest beneficiary of this round of AI computing power waves and is also one of the technology stocks with the largest gains in US stocks in recent years. RPS120 first broke through 80 in 2024 year 7 month, with the stock price approximately $128 at that time, followed by an explosion in demand for AI data centers, with the stock price rising to over $175, an interval gain of +756.1%. It is worth noting that NVDA's RPS showed 5 breaks through 80 signals during the entire uptrend cycle, indicating that the stock continued to maintain its leading position in the market. This is the best illustration of the "hold strong stocks" principle in CANSLIM.
Review and Analysis
Broadcom (AVGO) is the leader in AI network chips and custom AI accelerators (ASIC), benefiting from the demand of super-large cloud vendors for self-developed AI chips. RPS120 first broke through 80 in 2024 year 7 month, with the stock price approximately $171.63 at the time of the signal, followed by an interval gain of +721.3%. AVGO's RPS signal appeared 6 times, which is the target with the most frequent signals in this replay, indicating that the stock continued to maintain strength throughout the AI market, and is a typical "super strong stock".
Review and Analysis
AMD is the main competitor of Intel and an important participant in the AI GPU market (MI300X series). RPS120 first broke through 80 in 2024 year 7 month, with the stock price approximately $178.69 at the time of the signal, followed by an interval gain of +570.7%. AMD's case illustrates that in the AI computing power arena, even if the company is not the first in market share, as long as RPS remains strong, it can still obtain substantial returns. This also confirms the core concept in CANSLIM of "following the strong stocks in the market, rather than betting on the best fundamental stocks".
Review and Analysis
Meta Platforms (META) is the world's largest social media company and has invested heavily in AI infrastructure construction in recent years. RPS120 first broke through 80 in 2024 year 7 month, with the stock price approximately $526 at the time of the signal, followed by an interval gain of +240.2%. META's RPS signal appeared 6 times, indicating that the stock continued to maintain strength throughout the uptrend cycle. For large-cap tech stocks, the reliability of the RPS signal is often higher than that of small-cap stocks, because the continuous inflow of institutional funds will leave clearer traces on the RPS.
Review and Analysis
Axon Enterprise (AXON) is the leader in law enforcement technology, with its products including stun guns (Taser) and law enforcement cameras, actively laying out AI-driven law enforcement data platforms in recent years. RPS120 first broke through 80 in 2024 year 7 month, with the stock price approximately $302 at the time of the signal, followed by an interval gain of +297.5%. AXON is a typical case of a "non-mainstream sector leading stock", indicating that RPS stock selection is not limited to hot sectors, leading stocks in any industry can be identified through the RPS indicator.
Review and Analysis
Apple (AAPL) is the world's largest company by market capitalization and has recently launched the Apple Intelligence series of AI features. RPS120 first broke through 80 in 7 of 2024, with the stock price around $227 at the time of the signal, subsequently the range gain reached +85.6%. AAPL's gains were relatively small, which aligns with the characteristics of ultra-large cap companies—lower elasticity but higher stability. For investors seeking steady returns, large-cap leading stocks (such as AAPL, META) are lower-risk choices in the RPS strategy.
FAQ
View today's US stock RPS ranking
Real-time tracking of RPS rankings for over 8,000 US stocks, updated daily
View US stock RPS ranking →